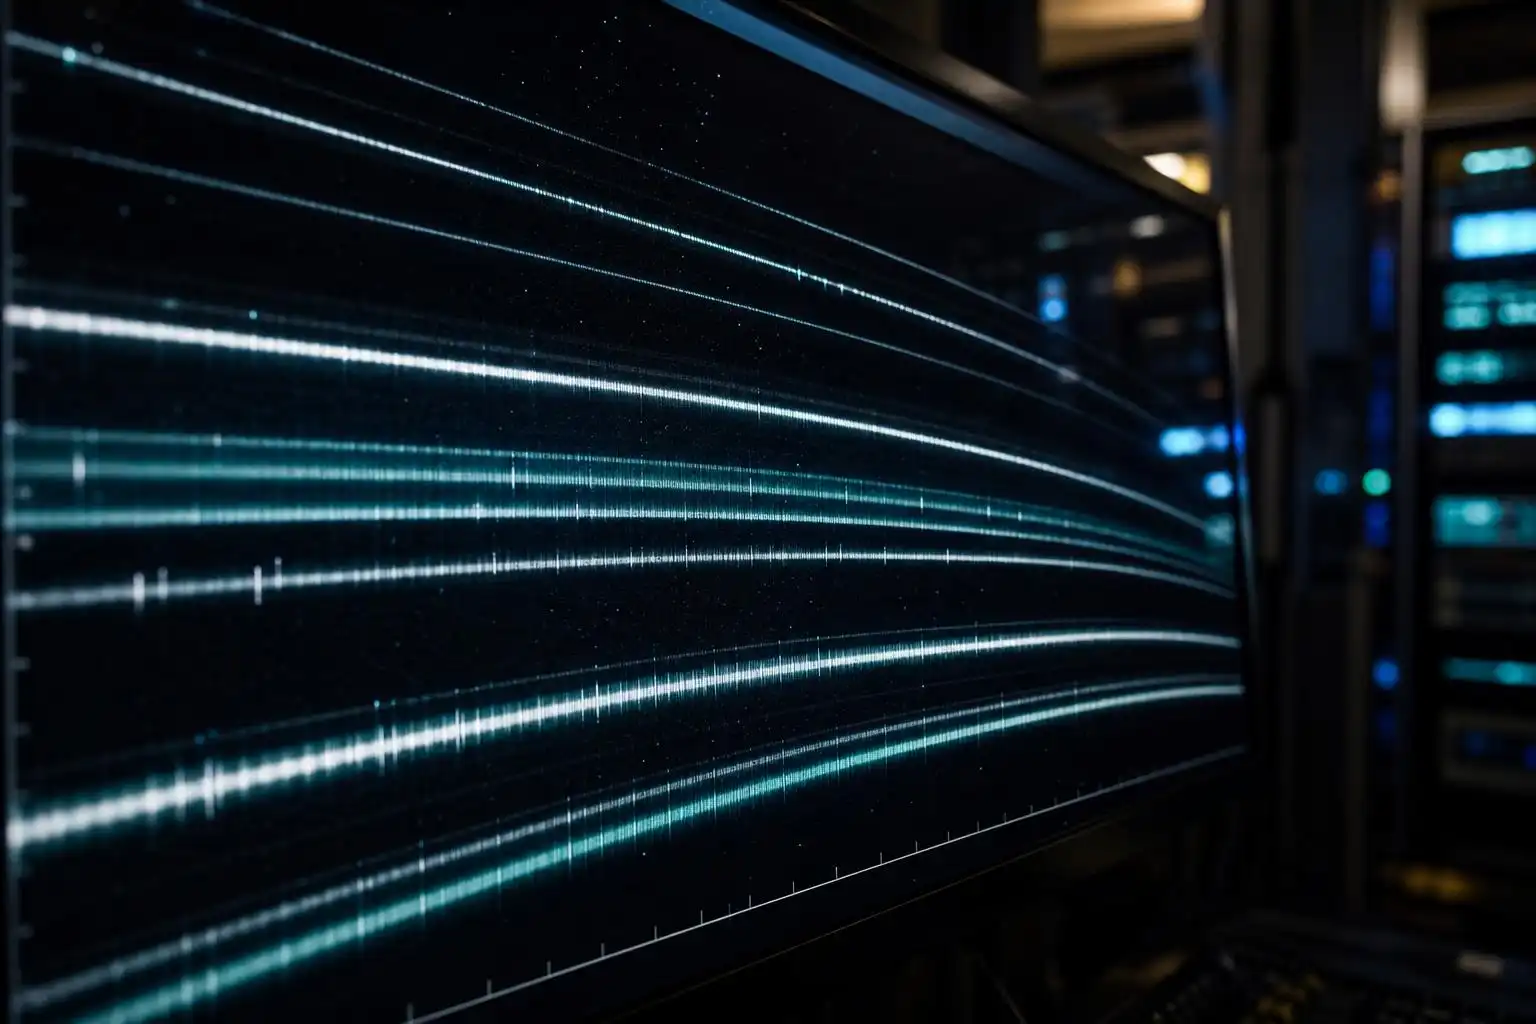

There is a moment, when you pull up a raw NIRSPEC frame on the Keck summit workstation at two in the morning, where the instrument announces itself without ceremony. Across the detector you see a stack of curved spectral orders — each one a ribbon of dispersed infrared light, each ribbon encoding a different slice of wavelength — and the sheer density of information is almost confrontational. This is not a pretty picture. It is a measurement machine’s confession, and learning to read it takes years.
NIRSPEC — the Near-Infrared Spectrograph at the W. M. Keck Observatory — has been doing this since 1999. It operates on Keck II, mounted at the Nasmyth focus behind the adaptive optics bench, and it covers wavelengths from roughly 0.95 to 5.5 microns across the Y, J, H, K, L, and M atmospheric windows. That range matters because the infrared is where cool objects radiate, where molecular absorption features live, and where dust that blocks optical light becomes progressively more transparent. NIRSPEC is not the flashiest instrument in the Keck suite, but for the problems it was built to solve, it remains one of the most capable spectrographs on any ground-based telescope.
The Echelle Architecture
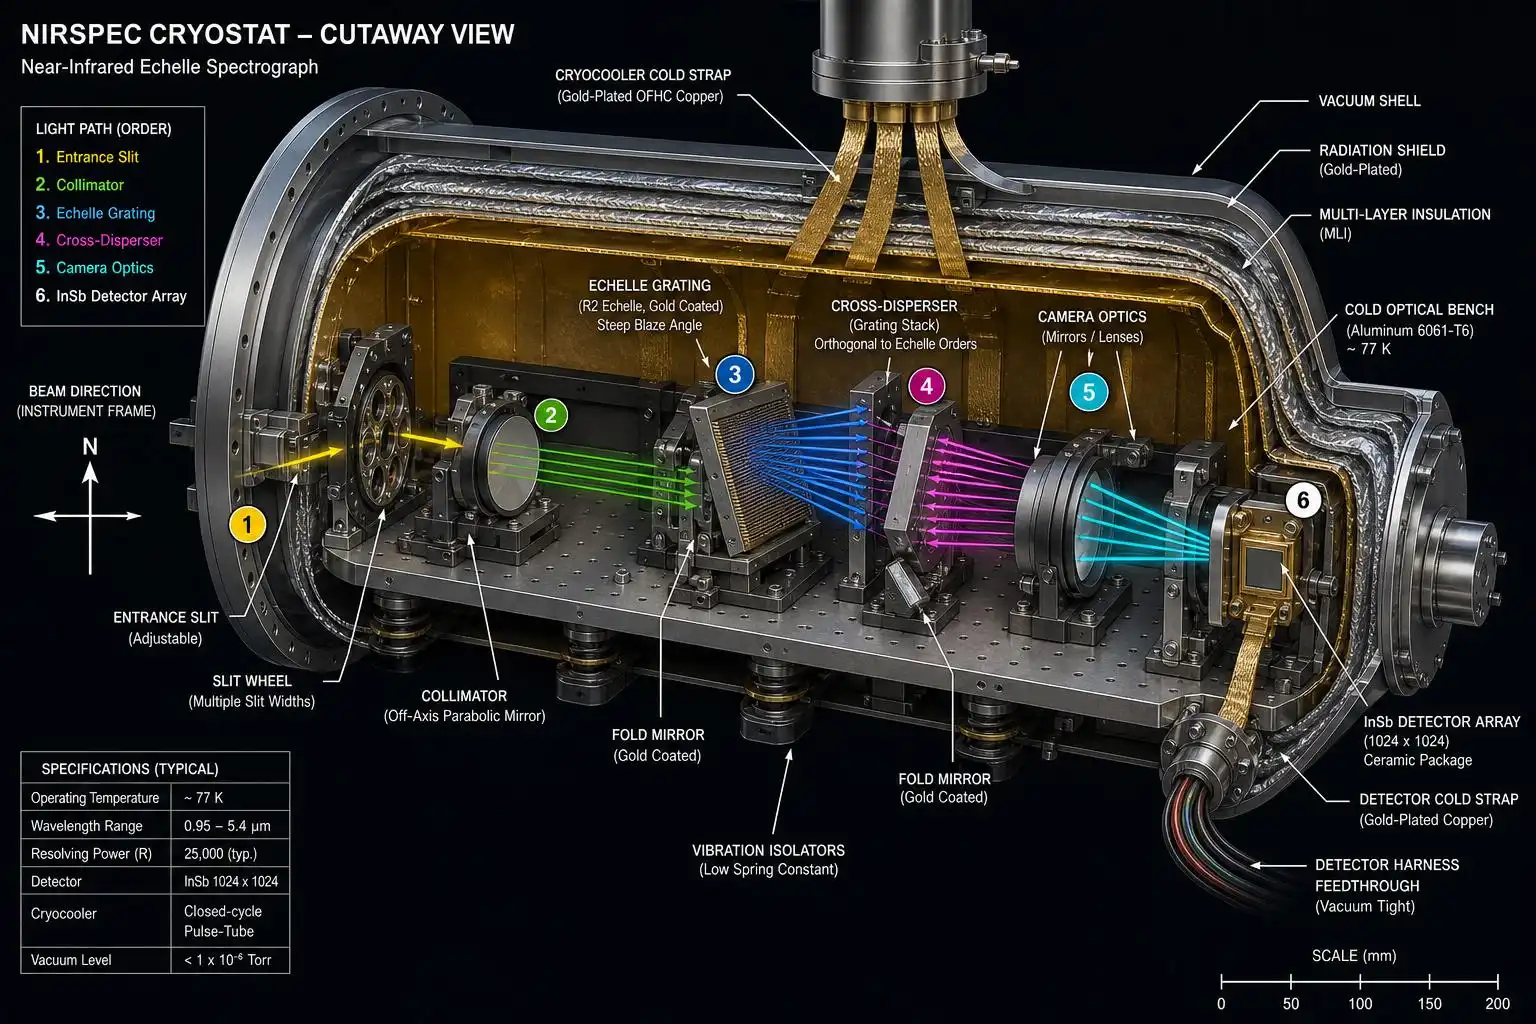
NIRSPEC is a cross-dispersed echelle spectrograph, and understanding what that phrase actually means is the key to understanding everything else about the instrument.
An echelle grating is ruled with relatively coarse groove spacing — NIRSPEC’s echelle has 52.67 grooves per millimeter — but it operates at a steep blaze angle, in this case 63.07 degrees. Working at high diffraction orders (typically orders 30–70 for NIRSPEC, depending on the band) allows the grating to achieve high spectral resolving power while still accepting a physically reasonable beam size. The penalty is that adjacent diffraction orders overlap spatially on the detector: order 35 and order 36 land on top of each other. You cannot simply read off the spectrum without first separating the orders.
That separation is the job of the cross-disperser — a second, lower-dispersion grating oriented perpendicular to the echelle. It spreads the orders apart in the spatial direction, so that what arrives at the detector is a two-dimensional grid: wavelength increasing along each curved ribbon, and order number increasing (or decreasing, depending on convention) across the chip. Each ribbon covers a different wavelength range, and the ensemble of ribbons together gives you broad wavelength coverage in a single exposure.
In high-resolution mode, NIRSPEC delivers a resolving power of R ≈ 25,000, which corresponds to a velocity resolution of about 12 km/s. In low-resolution mode (using a different grating configuration), R drops to roughly 2,000. Most of the instrument’s scientific legacy lives at high resolution, where individual molecular lines can be separated and measured.
The Detector: A 1024 × 1024 InSb Array
The heart of NIRSPEC’s original design is a 1024 × 1024 pixel indium antimonide (InSb) array manufactured by Raytheon (now Teledyne). InSb is the material of choice for 1–5 micron coverage because its bandgap at cryogenic temperatures corresponds to a photon energy cutoff near 5.5 microns, which neatly matches the long-wavelength edge of the M band before thermal background from the telescope itself overwhelms everything.
The detector must be cooled to approximately 35 Kelvin to suppress dark current to manageable levels. At room temperature, InSb’s narrow bandgap means thermally excited electrons flood the detector; at 35 K, the dark current drops to a few electrons per second per pixel, low enough that you can integrate for minutes on faint targets without dark current dominating the noise budget. The entire spectrograph — camera optics, grating, cross-disperser, and detector — lives inside a liquid-nitrogen-cooled cryostat. The instrument’s operating temperature is maintained to within a fraction of a Kelvin, because thermal stability directly affects wavelength calibration: if the grating substrate expands or contracts, the line positions shift.
Pixel scale at the detector translates to 0.144 arcseconds per pixel in the spatial direction when NIRSPEC is used without adaptive optics, and approximately 0.0194 arcseconds per pixel in AO mode — a factor of roughly seven finer, matching the much smaller diffraction-limited point spread function that AO delivers. The slit widths available range from 0.043 arcseconds (used in AO mode) to 0.576 arcseconds for seeing-limited work. Slit width is the primary lever on resolving power: a narrower slit admits less of the seeing disk but samples a smaller range of grating angles, pushing R higher.
Wavelength Calibration: Neon, Argon, and the Atmosphere Itself
Getting precise wavelengths out of an echelle spectrograph requires a calibration source whose emission lines are known to better accuracy than you need in your science spectrum. NIRSPEC uses arc lamps — neon and argon — that illuminate the slit with a forest of narrow emission lines spanning the infrared. In the K band (roughly 2.0–2.4 microns), you might have a dozen or more usable argon lines per order, and the fitting of a polynomial to their known vacuum wavelengths versus their pixel positions gives you a wavelength solution accurate to a small fraction of a pixel.
But there is a second calibration source that costs nothing and is always available: the Earth’s own atmosphere. Telluric absorption features — the deep bands where water vapor, CO₂, methane, and oxygen absorb starlight — are imprinted on every spectrum. These features are a nuisance for science (they can obscure the very lines you want to measure), but they are also extremely precise wavelength markers. Their rest wavelengths are known to better than 1 part in 10⁷ from laboratory spectroscopy. Observers routinely use telluric features to verify and refine the arc-lamp wavelength solution, particularly for radial velocity work where you need to know whether a stellar line has shifted by a few hundred meters per second.
Removing the telluric features themselves requires observing a rapidly rotating A-type star — a “telluric standard” — at a similar airmass and time as your science target. The A star has a nearly featureless intrinsic spectrum in the infrared (aside from hydrogen Brackett series lines, which can be interpolated over), so dividing your science spectrum by the A-star spectrum cancels the telluric absorption to first order. In practice, imperfect cancellation leaves residuals at the few-percent level in regions of heavy absorption, which is why observers plan their programs around the cleanest telluric windows.
What NIRSPEC Was Built to Measure
The instrument’s original science drivers were cool stars, brown dwarfs, and the Galactic center — three problems that share a common thread: you need infrared wavelengths to see through or past dust, and you need high spectral resolution to extract physical parameters.
For cool stars and brown dwarfs, the K-band spectrum is rich with CO overtone bandheads starting near 2.29 microns, water vapor absorption, and atomic lines of sodium, calcium, and magnesium. The depths and shapes of these features encode effective temperature, surface gravity, and metallicity. A brown dwarf at 1500 K radiates most of its light in the near-infrared, and its optical spectrum is so heavily blanketed by TiO, VO, and dust opacity that the infrared is the only window where you can measure its properties cleanly.
The Galactic center program is perhaps NIRSPEC’s most celebrated application. The center of the Milky Way is hidden behind roughly 30 magnitudes of visual extinction — a factor of 10¹² in optical flux — but only about 3 magnitudes of K-band extinction. Andrea Ghez and her UCLA group used NIRSPEC and other Keck instruments in combination with Keck’s laser guide star adaptive optics system to measure radial velocities of stars orbiting within a fraction of a parsec of Sgr A*, the central supermassive black hole. Combined with proper motions from imaging, these radial velocities gave full three-dimensional orbital solutions. The star S0-2 (also called S2 in some conventions) has an orbital period of about 16 years and a closest approach — pericenter — of roughly 120 AU from a 4-million-solar-mass black hole. The 2018 detection of the gravitational redshift predicted by general relativity at pericenter, at a significance of several sigma, relied on combined astrometric and spectroscopic data from multiple instruments including AO-fed integral-field spectroscopy. That is a spectrograph doing general relativity.
The AO Interface and Slit Acquisition
Using NIRSPEC behind AO changes the character of the observing session entirely. The AO system — NIRC2 is the dedicated AO imager, but NIRSPEC has its own AO feed — delivers a corrected beam to the spectrograph slit, and the slit itself becomes the critical alignment surface. At K band with the laser guide star system running, the Strehl ratio on Keck II reaches 30–40%, meaning 30–40% of the stellar light is concentrated into the diffraction core rather than scattered into the seeing halo. For a 0.043-arcsecond slit, this matters enormously: in seeing-limited conditions, most of the light from a point source misses the slit entirely, and throughput is poor. With AO, the diffraction core — roughly 0.055 arcseconds FWHM at K band on a 10-meter aperture — is comparable to the slit width, and throughput climbs dramatically.
Slit acquisition is a careful process. You first acquire the target on a slit-viewing camera (SCAM, a small 256 × 256 InSb array that images a region around the slit), confirm that the AO loop is closed and the correction is stable, then dither the telescope to position the star precisely on the slit. Guiding during a long exposure is done by the AO system itself, which tracks the tip-tilt residuals from the wavefront sensor and feeds corrections back to the telescope. Typical integration times per exposure are 300–900 seconds, and a complete observation of a faint target might involve co-adding dozens of such exposures taken in an ABBA nod pattern — nodding the telescope along the slit to place the star alternately at two positions, so that subtracting A from B cancels the sky background and detector bias structure simultaneously.
Sensitivity and the Thermal Background Problem
Beyond about 3 microns — into the L and M bands — ground-based infrared spectroscopy becomes a battle against thermal emission. The telescope mirrors, the warm parts of the instrument, and the atmosphere itself all radiate as roughly 270 K blackbodies, and at 3.5 microns the short-wavelength Wien tail of this emission begins to contribute significantly to the detector background. By 5 microns, the background is so bright that individual exposures must be kept short — a few seconds — to avoid saturating the detector, and the noise is dominated by photon noise from the background rather than from the source.
This is why NIRSPEC’s L- and M-band capabilities, while real, are used selectively. The M-band CO fundamental transitions near 4.7 microns are scientifically valuable — they trace warm molecular gas in protostellar disks, stellar atmospheres, and active galactic nuclei — but extracting them requires careful background subtraction, short integrations, and a target bright enough to compete with the sky. The sweet spot for NIRSPEC in terms of sensitivity and background is the J, H, and K bands, where the sky is dark between telluric absorption bands and the detector background is negligible.
Twenty-Five Years of Infrared Spectroscopy
NIRSPEC received a major detector upgrade in 2018, replacing the original 1024 × 1024 InSb array with a newer 2048 × 2048 HAWAII-2RG HgCdTe detector. HgCdTe (mercury cadmium telluride) is a tunable semiconductor: by adjusting the cadmium fraction, manufacturers can set the bandgap and thus the long-wavelength cutoff. The NIRSPEC upgrade uses a composition tuned to maintain sensitivity out to approximately 5 microns, preserving the instrument’s full wavelength coverage across the Y, J, H, K, L, and M bands. The larger format also means more simultaneous wavelength coverage per order and better sky sampling.
The upgrade was not trivial. NIRSPEC’s cryostat had to be opened — a weeks-long process involving careful warming, venting, detector swap, realignment of the focal plane, and recommissioning — and the new detector’s read noise characteristics required updates to the data reduction pipeline. Read noise on the HAWAII-2RG in multiple non-destructive read mode (using up-the-ramp sampling) reaches approximately 5 electrons RMS, compared to roughly 30 electrons for a single correlated double sample. That factor of six improvement in read noise matters most for faint targets in short exposures, exactly the regime where NIRSPEC is pushed hardest.
What the Ribbons Are Telling You
Back to that raw frame on the summit workstation. The curved ribbons across the chip are curved because the slit is not perfectly aligned with the detector rows — a deliberate tilt that allows more orders to fit without overlap — and because the grating equation produces slightly curved constant-wavelength loci when projected through the camera optics. Straightening those curves, identifying which order each ribbon corresponds to, fitting the wavelength solution, subtracting the sky, dividing by the telluric standard, and finally extracting a one-dimensional spectrum from each order: that is the data reduction cascade, and it takes as long as the observation itself.
What you get at the end is a set of one-dimensional spectra, each covering a few tens of nanometers, stitched together to cover whatever band you observed. The continuum is not perfectly flat — it carries the blaze function of the echelle, the throughput curve of the camera optics, and the spectral energy distribution of the star — but the line positions and equivalent widths are there, waiting to be compared against model atmospheres, laboratory databases, or the spectra of comparison stars observed the same night.
This is the discipline of infrared spectroscopy: not a single measurement but a chain of calibrations, each one introducing its own uncertainties, each one requiring its own standard observations, and each one demanding that the observer understand not just what the instrument is doing but why. NIRSPEC has been doing this chain reliably for a quarter century, on targets ranging from exoplanet host stars to the stars orbiting the Milky Way’s central black hole. The engineering that keeps a cryostat at 35 Kelvin through a Hawaiian summit night, that holds a grating stable enough to measure 12 km/s velocity shifts, that routes an adaptive-optics-corrected beam onto a 43-milliarcsecond slit — that engineering is the invisible infrastructure of every result that comes out of it.



Leave a Reply