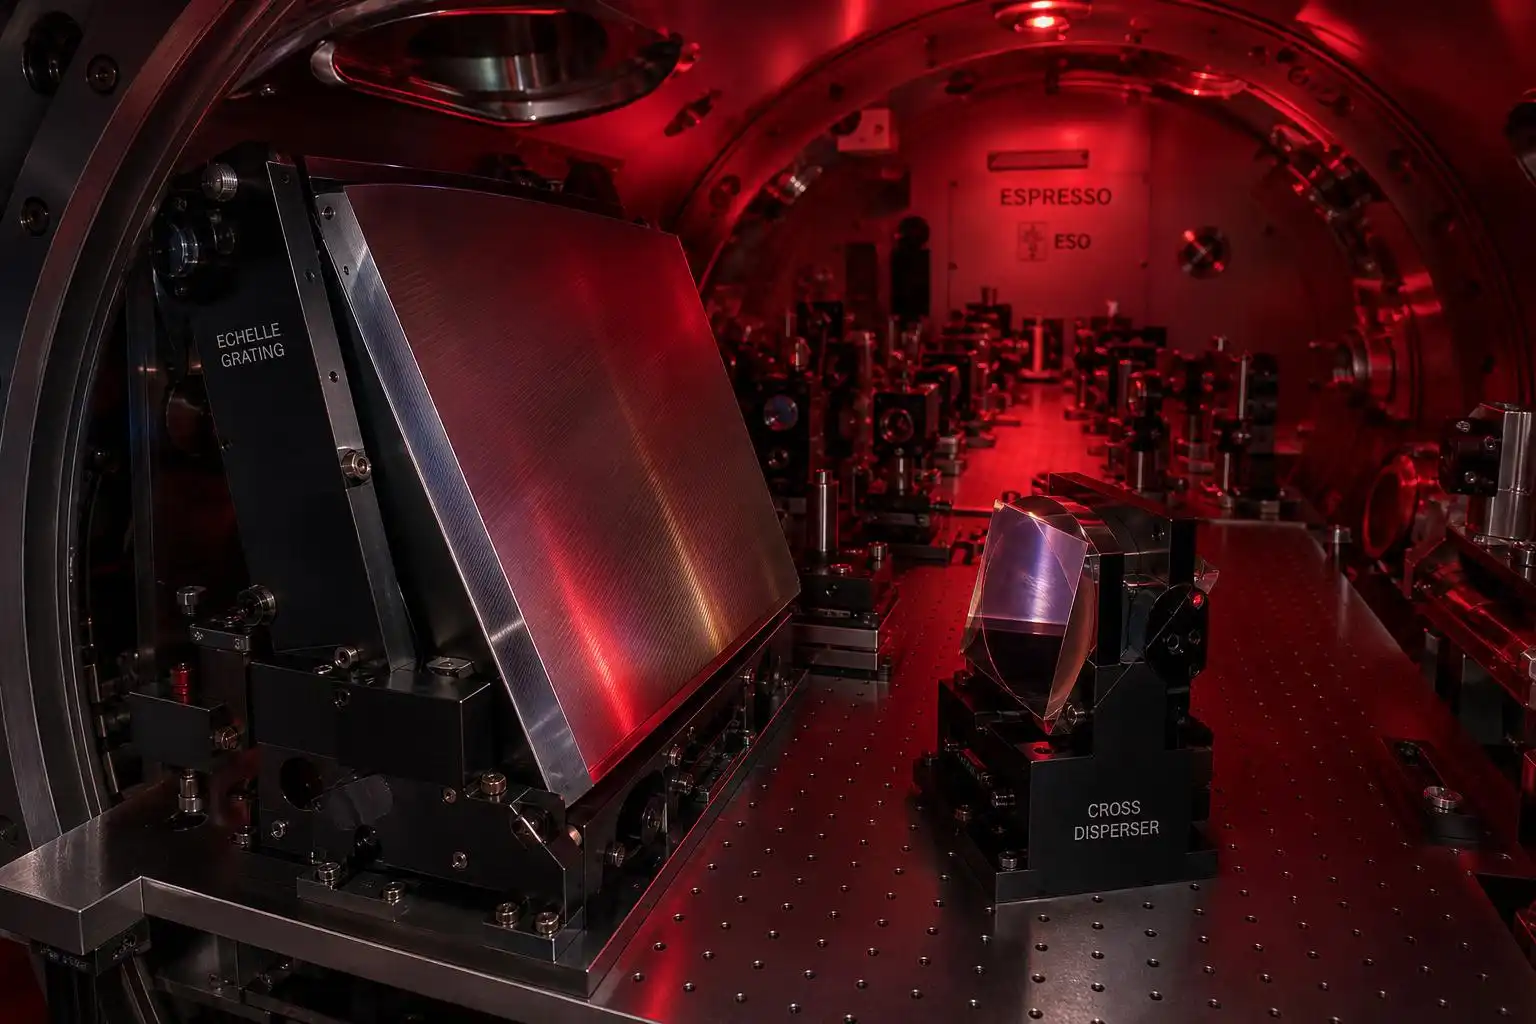

A spectrograph that can detect a star wobbling at the walking pace of a slow stroll — about 10 centimeters per second — sounds like the premise of a thought experiment. ESPRESSO, the Echelle SPectrograph for Rocky Exoplanet and Stable Spectroscopic Observations, is the real thing. Installed at the Paranal Observatory in Chile and fed by the European Southern Observatory’s Very Large Telescope, it is the most precise radial-velocity machine currently operating on a large ground-based telescope. Understanding what it takes to reach that precision means following a single photon from starlight to pixel, and asking, at every step, what could go wrong.
Why Radial Velocity Still Matters
The transit method — watching a planet dim its star as it crosses the disk — dominates exoplanet statistics. But transits only work when orbital geometry cooperates, and they tell you a planet’s radius, not its mass. Mass requires radial velocity: measuring the Doppler shift of the star’s spectral lines as the planet’s gravity tugs it back and forth along the line of sight. For an Earth-mass planet in the habitable zone of a Sun-like star, that tug produces a stellar velocity amplitude of roughly 9 cm/s — a signal so small it was considered unreachable when HARPS, ESPRESSO’s predecessor at La Silla, was commissioned in 2003. HARPS itself pushed precision to about 1 m/s, which was enough to detect Neptune-mass planets and super-Earths, but the Earth analogue remained out of reach. ESPRESSO was designed to close that gap by a factor of ten.
The Instrument in Brief
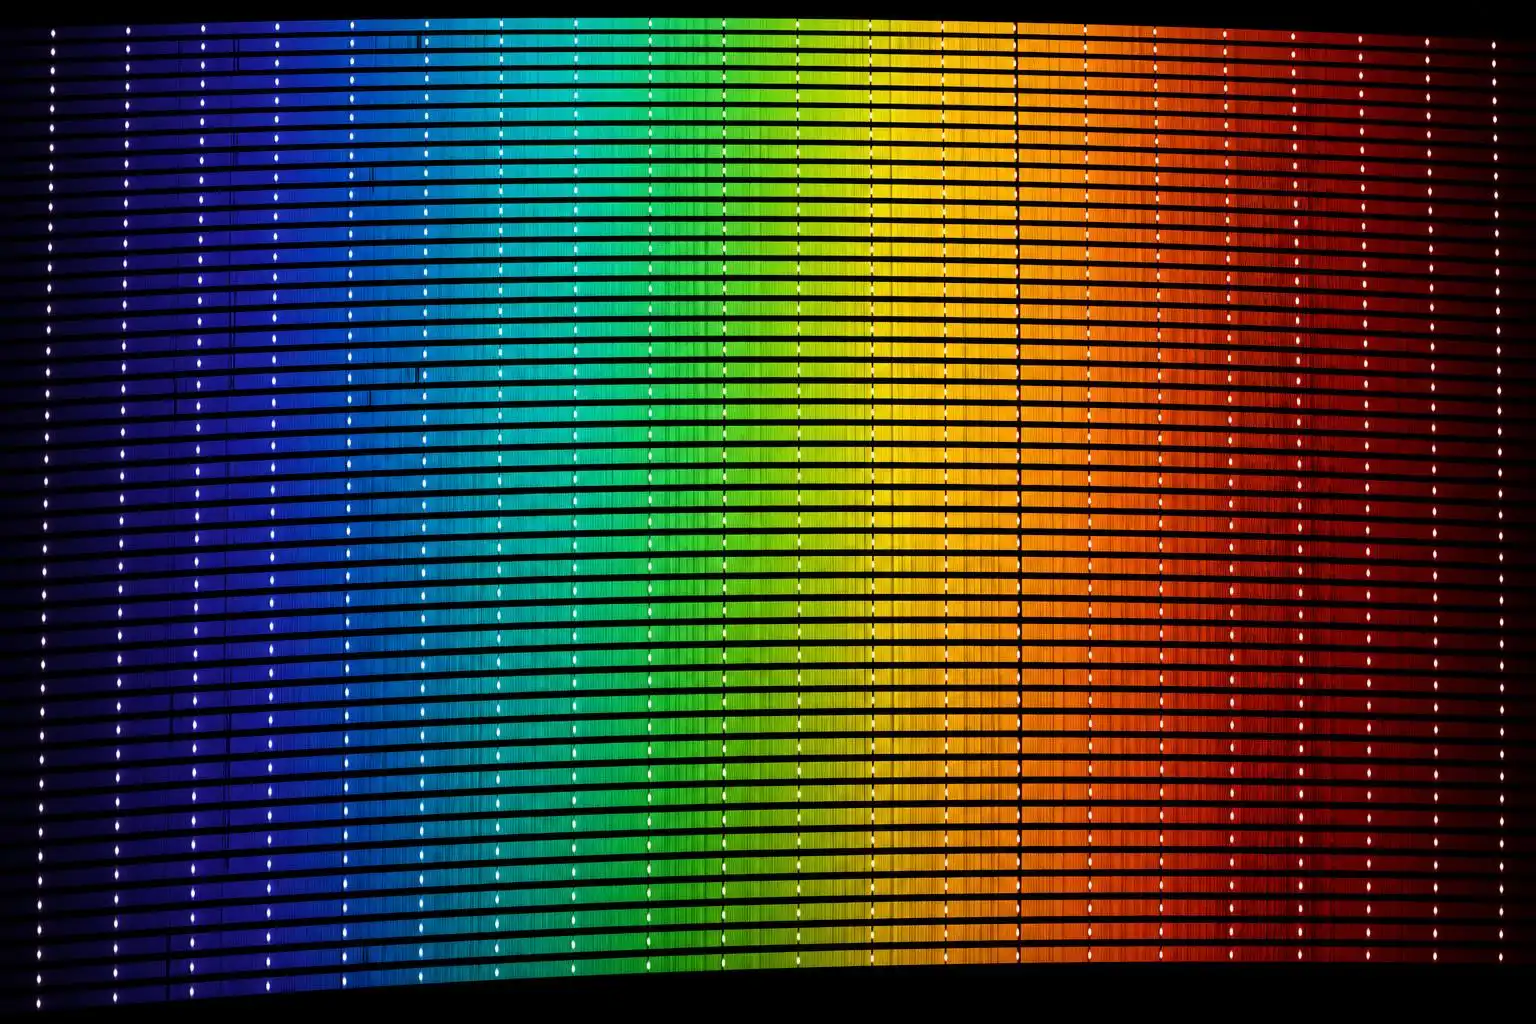
ESPRESSO sits in the Combined Coudé Laboratory beneath the VLT platform, a thermally and mechanically isolated room that the four Unit Telescopes share via a network of coudé trains — optical relay paths that carry starlight underground without exposing it to the open air. Each UT can feed ESPRESSO independently, or all four can be combined to act as a single 16-meter equivalent aperture for faint targets. In single-UT mode, the spectrograph covers 380–788 nm at a resolving power of R ≈ 140,000 in high-resolution mode, or R ≈ 70,000 in high-efficiency mode. That resolving power — the ability to separate wavelengths differing by one part in 140,000 — is what turns a Doppler shift of 10 cm/s into a measurable displacement on the detector.
The detector itself is a mosaic of two 9k × 9k CCDs tiled end-to-end, covering the red and blue arms of the cross-dispersed echelle format. Because ESPRESSO is fiber-fed, the concept of sky subtended per pixel does not apply in the way it would for an imager; the spectral pixel scale is what matters, where 1 pixel corresponds to about 0.5 km/s. Reaching 10 cm/s therefore means measuring line centroids to 1/5000th of a pixel — a statistical feat that requires thousands of spectral lines and signal-to-noise ratios above 200 per pixel.
Wavelength Calibration: The Laser Frequency Comb
The oldest enemy of radial-velocity precision is wavelength calibration drift. If the spectrograph’s dispersion solution shifts between observations — because a lamp ages, a temperature fluctuates, or a fiber moves — the stellar lines appear to shift even when the star is perfectly still. HARPS relied on a thorium-argon hollow-cathode lamp, whose emission lines are fixed in wavelength by atomic physics but vary in brightness and are unevenly distributed across the spectrum. ESPRESSO uses a laser frequency comb (LFC) as its primary calibrator.
A laser frequency comb generates a spectrum of equally spaced, laser-sharp emission lines whose absolute frequencies are tied to an atomic clock. The spacing between comb teeth delivered to the spectrograph is set by a Fabry-Pérot filtering cavity that selects a much wider mode spacing from the underlying laser repetition rate — in ESPRESSO’s case, the filtered comb lines reaching the detector are separated by about 18 GHz, which at 550 nm corresponds to roughly 18 pm, a spacing the spectrograph can resolve without blending adjacent lines. The result is a calibration grid with sub-meter-per-second intrinsic stability, traceable to SI units, and uniform enough to illuminate the echelle format across a broad wavelength range.
In practice, the LFC is not always running — it requires warm-up time and careful alignment — so ESPRESSO also maintains a Fabry-Pérot etalon as a secondary calibrator for simultaneous reference during science observations. The etalon is not as absolutely stable as the LFC, but it tracks short-term drifts during an exposure with residuals below 10 cm/s over the timescale of a typical integration.
Thermal and Mechanical Stability
Wavelength calibration only matters if the spectrograph itself holds still. ESPRESSO’s vacuum vessel maintains the echelle grating and cross-disperser at a temperature stable to ±0.001 K over 24 hours. This is not a minor engineering footnote. A one-millikelvin temperature excursion in the glass of a large echelle grating causes a thermal expansion that shifts spectral lines by a fraction of a pixel — at ESPRESSO’s precision budget, that fraction is not negligible. The vacuum environment eliminates pressure-driven refractive index changes in air, which would otherwise mimic Doppler shifts at the few-cm/s level.
The coudé train that carries starlight from each UT to the underground lab uses octagonal optical fibers rather than circular ones. The octagonal cross-section scrambles the near-field and far-field illumination patterns of the fiber output more effectively than a circular fiber, so that guiding errors and seeing variations at the telescope entrance do not translate into a shifting illumination pattern on the spectrograph slit. This scrambling gain — the ratio of input illumination variation to output illumination variation — is a critical number. For a circular fiber it is of order 100; for an octagonal fiber it reaches several thousand. At 10 cm/s precision, even a 0.1% shift in the centroid of the fiber output illumination would produce a spurious velocity signal.
Stellar Noise: The Irreducible Floor
Here is the uncomfortable truth that ESPRESSO’s designers knew from the start: at 10 cm/s, the instrument is no longer the limiting factor for most stars. The Sun itself oscillates with a five-minute p-mode period, producing velocity amplitudes of order 1 m/s. Averaging over 15-minute integrations suppresses this to roughly 10 cm/s — which is why ESPRESSO’s standard observing strategy for bright solar-type stars uses 15-minute exposures. But granulation — the convective overturning of the photosphere — produces a slower, stochastic velocity signal at the 50 cm/s level with a correlation timescale of minutes to hours. Magnetic activity, spots, and faculae impose quasi-periodic signals at the stellar rotation period, which for a Sun-like star is weeks to months, and at amplitudes that can reach meters per second.
This means that detecting a true Earth analogue with ESPRESSO requires not just one or two precise measurements, but a long, carefully designed observing campaign that can statistically disentangle the planetary signal from the stellar noise floor. Spectral activity indicators — the Ca II H&K emission cores, the Hα line, line-shape asymmetries quantified by the bisector inverse slope — are measured simultaneously with the radial velocity in every ESPRESSO spectrum, providing the diagnostic toolkit to model and subtract stellar contributions. The instrument delivers all of this in a single observation because its spectral coverage includes both the blue Ca II lines near 393 nm and the red Hα line at 656 nm without any detector gap.
ESPRESSO’s Early Science
Since first light in 2018, ESPRESSO has redefined what is measurable from the ground. It confirmed and refined the mass of 55 Cancri e, a lava-world super-Earth orbiting so close to its star that a year lasts 18 hours, pinning its mass to better than 5% and enabling meaningful interior structure modeling. It detected the atmosphere of WASP-189 b in transmission by resolving individual iron and titanium lines during transit — a measurement that required the full R = 140,000 resolving power to separate planetary absorption from the stellar spectrum. The combined four-UT mode has been used to study the fine structure of quasar absorption spectra, probing whether the fine-structure constant varies across cosmic time — a question that requires measuring line separations to a few meters per second over a spectral baseline of hundreds of nanometers.
Perhaps most tellingly, ESPRESSO has been used to observe the Sun itself via a solar feed — a small telescope on the Paranal platform that injects sunlight into the ESPRESSO fiber as if the Sun were a distant star. These solar observations, which are carried out during the day and complement the nighttime stellar programs, provide a ground truth for understanding stellar noise at the level of detail that no other star can offer. The solar data have already shown that granulation noise is not white: it has a characteristic power spectrum that, in principle, can be modeled and subtracted, pushing the effective noise floor below 10 cm/s on timescales longer than a day.
What 10 cm/s Actually Demands
Step back and consider the chain of requirements that 10 cm/s imposes. The Doppler formula relates velocity to wavelength shift: Δλ/λ = v/c. At v = 0.1 m/s and λ = 550 nm, Δλ = 0.18 femtometers — about one-five-hundred-thousandth of the diameter of a hydrogen atom. No spectrograph measures individual wavelengths to that precision. What it measures is the collective centroid of thousands of spectral lines, each contributing a small fraction of the total signal, averaged over a detector with ~164 million pixels. The photon noise on a single line in a single pixel is enormous compared to 10 cm/s; it is only the coherent shift of all lines together, combined with a calibration reference that is equally stable, that makes the measurement possible.
This is why ESPRESSO is not just a spectrograph but a system: telescope, coudé train, fiber scrambler, vacuum vessel, thermal control, laser frequency comb, Fabry-Pérot etalon, CCD mosaic, and data reduction pipeline all contribute to the error budget, and all must perform simultaneously. The data reduction pipeline alone — which handles order extraction, blaze correction, wavelength solution, barycentric correction, and cross-correlation against a stellar template — took years to validate and is still being refined as the solar feed data reveal systematic errors at the few-cm/s level that were invisible at 1 m/s.
There is something clarifying about an instrument that demands this level of discipline. Every component that was “good enough” for HARPS had to be examined and either improved by an order of magnitude or replaced. The result is an observatory within an observatory: a room underground at Paranal, kept colder and stiller than almost any other place on the mountain, listening for the faintest gravitational whisper of a world that might, in some distant future, be worth a closer look.


Leave a Reply