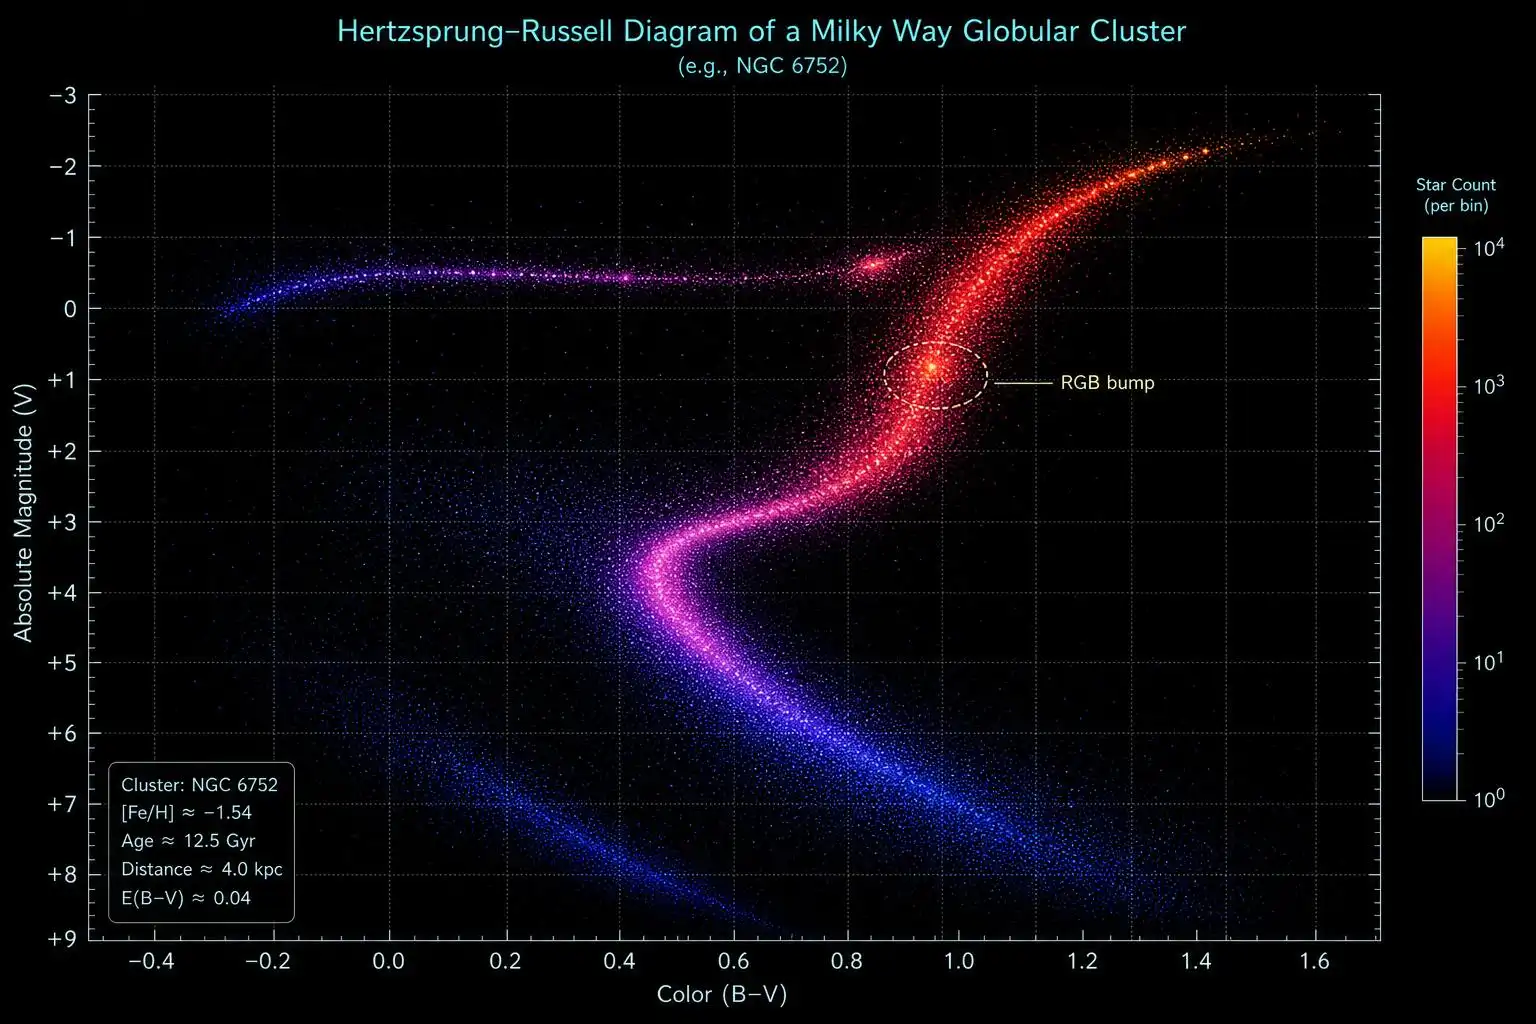

Climb the red giant branch on a Hertzsprung–Russell diagram and the story looks deceptively smooth: a star leaves the main sequence, its core contracts, its envelope swells, and it marches up a nearly vertical track toward higher luminosity and cooler surface temperatures. But look carefully at the luminosity function of an old stellar population — a globular cluster like 47 Tucanae or M5 — and you’ll notice a subtle excess of stars piled up at a specific luminosity. Stars seem to linger there, as though the branch has a speed bump. It does. The feature is called the red giant branch bump, and it’s one of the cleanest probes we have of what’s happening deep inside a star that looks, from the outside, perfectly serene.
What Drives Stars Up the Red Giant Branch
To understand the bump, you need the basic machinery of red giant evolution. After core hydrogen exhaustion, a star of 0.8–2 M☉ develops a degenerate helium core surrounded by a hydrogen-burning shell. That shell is the star’s power source, and it’s thin — only a few percent of the stellar radius — but it generates essentially all of the luminosity. As the shell burns outward in mass coordinate, it deposits helium ash onto the core, the core grows, and by a well-known scaling relation the luminosity rises steeply. This is why the red giant branch is nearly vertical in the HR diagram: luminosity is a sensitive function of core mass, roughly L ∝ M_c^7 or steeper in some approximations, so even modest core growth drives large luminosity increases.
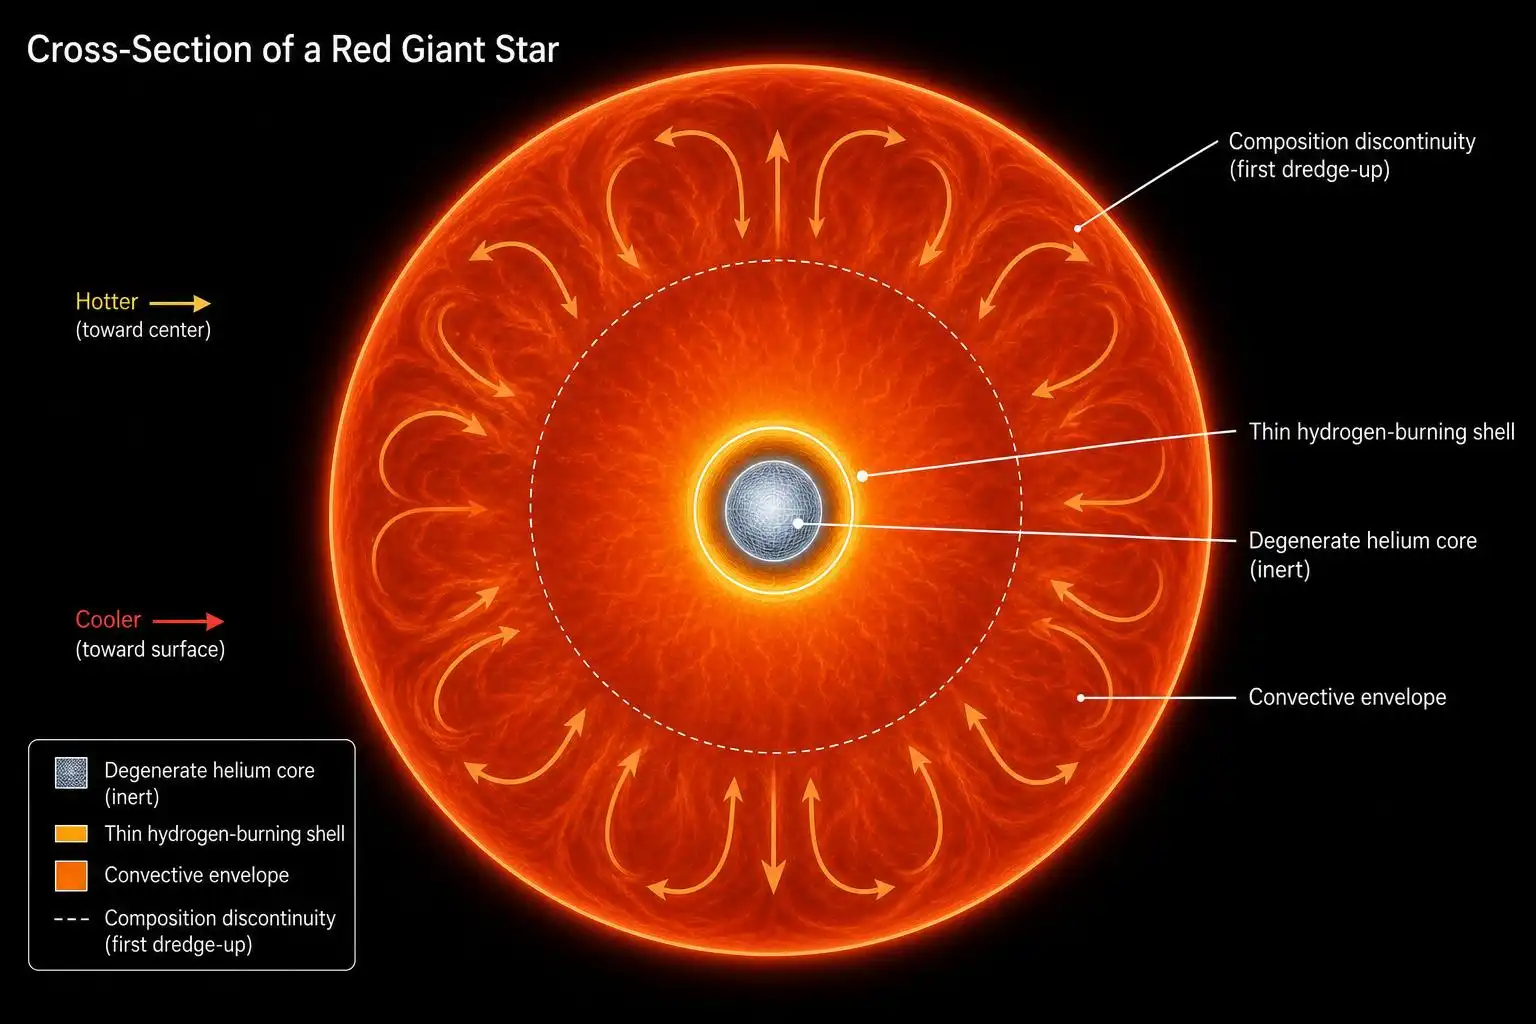
The envelope, meanwhile, is deeply convective. When the star first expands off the main sequence, convection from the surface plunges inward, dredging up material from layers that were previously near the burning regions. This is the first dredge-up. The convective envelope reaches its maximum depth — its deepest penetration in mass coordinate — and then retreats back toward the surface as the star continues ascending the branch.
The Discontinuity That Causes the Bump
Here is the key physics. The relevant composition feature in old, low-mass red giant stars is produced during first dredge-up. As the convective envelope reaches its maximum depth and then retreats, it leaves behind a sharp discontinuity in the hydrogen abundance profile at the maximum depth reached by the convective envelope. Below that boundary, the hydrogen abundance X is lower — material there was partially processed. Above it, X is higher — pristine envelope composition.
As the hydrogen-burning shell marches outward in mass, it eventually reaches this composition discontinuity. When it does, it suddenly finds itself in hydrogen-richer fuel. More hydrogen means the shell can sustain its burning at a slightly lower temperature and pressure — the shell effectively “relaxes.” The core mass growth rate temporarily slows, and with it, the luminosity growth rate stalls. The star spends more time near this luminosity than it does above or below it, producing the observed excess in the luminosity function.
Once the shell burns through the discontinuity and enters the chemically homogeneous envelope above it, normal evolution resumes and the star continues its march up the branch toward the helium flash.
Reading the Bump in Globular Clusters
The bump manifests observationally as a local peak in the differential luminosity function — a histogram of how many stars are found at each absolute magnitude along the red giant branch. In a well-populated globular cluster, you’re essentially watching thousands of stars at the same age and metallicity tick through their evolution, so the number of stars at any luminosity is inversely proportional to the evolutionary speed at that point. Slow down, and stars pile up.
The bump’s absolute magnitude depends on metallicity. In absolute terms, more metal-poor populations typically have brighter RGB bumps (lower V-band absolute magnitudes), while more metal-rich clusters have fainter bumps. Relative to the horizontal branch, metal-poor clusters like M92 ([Fe/H] ≈ −2.3) often show the bump brighter than the horizontal branch. This metallicity dependence arises because opacity and the depth of first dredge-up both change with composition, altering where the composition discontinuity sits in mass coordinate and thus at what core mass — and luminosity — the shell encounters it.
The parameter astronomers track is ΔV_bump^HB: the magnitude difference between the bump and the horizontal branch level. It’s a clean observable because both features appear in the same photometric dataset, and many systematic errors cancel. Measured values range from roughly +0.4 mag in metal-rich clusters to −0.5 mag or more in the most metal-poor ones, a swing of nearly a full magnitude driven by metallicity alone.
The Tension with Stellar Models
Here’s where the bump becomes genuinely scientifically interesting rather than merely pedagogically useful: for decades, models predicted the bump at a luminosity systematically brighter than observed. The discrepancy was small — roughly 0.2–0.3 mag in ΔV_bump^HB — but persistent across different stellar evolution codes and different clusters. That’s not a rounding error; it’s a real signal that something in the models is slightly wrong.
The leading suspect is extra mixing just below the convective envelope. Standard stellar models use the Schwarzschild criterion to define the convective boundary: convection stops where the radiative temperature gradient equals the adiabatic gradient. But real stellar interiors almost certainly have some overshoot — convective plumes carry momentum and penetrate slightly into the formally stable region below. Even a small amount of convective undershooting during the first dredge-up phase would deepen the envelope’s penetration and leave the composition discontinuity at a smaller mass coordinate. The hydrogen-burning shell then encounters it earlier, at a lower core mass, which means lower luminosity — shifting the predicted bump fainter and potentially resolving the discrepancy.
Other proposed mechanisms include atomic diffusion (helium settling and hydrogen floating, which subtly alter the composition profile) and rotational mixing, which can smear out the sharp discontinuity and reduce the bump’s amplitude without shifting its position dramatically. The amplitude of the bump — how pronounced the pile-up is — is itself a constraint: a very diffuse composition gradient produces a weaker bump, while a sharp step produces a stronger one.
Helium Abundance from the Bump
One of the more elegant applications of the RGB bump is measuring the helium abundance of old stellar populations. Helium is notoriously difficult to measure directly in cool stars — the relevant spectral lines require temperatures above ~10,000 K to be visible, and red giants sit around 4,000–5,000 K. You simply cannot read off Y (the helium mass fraction) from a spectrum of a red giant.
But the bump’s luminosity is sensitive to Y. Higher helium content means a higher mean molecular weight in the core, which affects the core mass at which the hydrogen shell ignites and subsequently how quickly the shell burns outward. Increasing Y by 0.01 shifts the bump by a measurable fraction of a magnitude. By comparing the observed bump luminosity to a grid of models with varying Y, astronomers can infer the helium abundance of a cluster’s stars — a technique that has been used to argue that some clusters, like NGC 2808 and ω Centauri, harbor multiple stellar populations with genuinely different helium abundances, some enriched to Y ≈ 0.35–0.40 compared to the primordial Y ≈ 0.245.
A Probe of Interior Physics, Not Just Chemistry
What makes the RGB bump so valuable is precisely its specificity. It doesn’t probe the entire interior; it probes one thin shell at one moment in time — the instant the hydrogen-burning shell crosses the composition discontinuity left by first dredge-up. That specificity makes it a scalpel rather than a sledgehammer. You’re not fitting the entire evolutionary track; you’re pinning down one feature whose position depends on a small set of physical inputs: the depth of the convective envelope during first dredge-up, the sharpness of the resulting composition gradient, and the helium abundance.
Every time a new generation of stellar evolution codes refines the treatment of convective boundaries — whether through 3D hydrodynamic simulations of convective penetration, improved opacity tables, or better nuclear reaction rates for the p-p chain and CNO cycle — the RGB bump is one of the first tests they run. It’s a benchmark precisely because it’s sensitive to physics that is otherwise hard to isolate.
The next time you look at a color-magnitude diagram of a globular cluster and trace the graceful arc of the red giant branch, remember that the branch is not smooth. Somewhere along that arc, hidden in the statistics of thousands of stars, is a slight hesitation — a moment when a hydrogen-burning shell hits a wall of its own making and has to push through. That hesitation, measured to a tenth of a magnitude, is telling us something real about the boundary between order and turbulence inside a dying star.



Leave a Reply